Clients Table / Dashboard
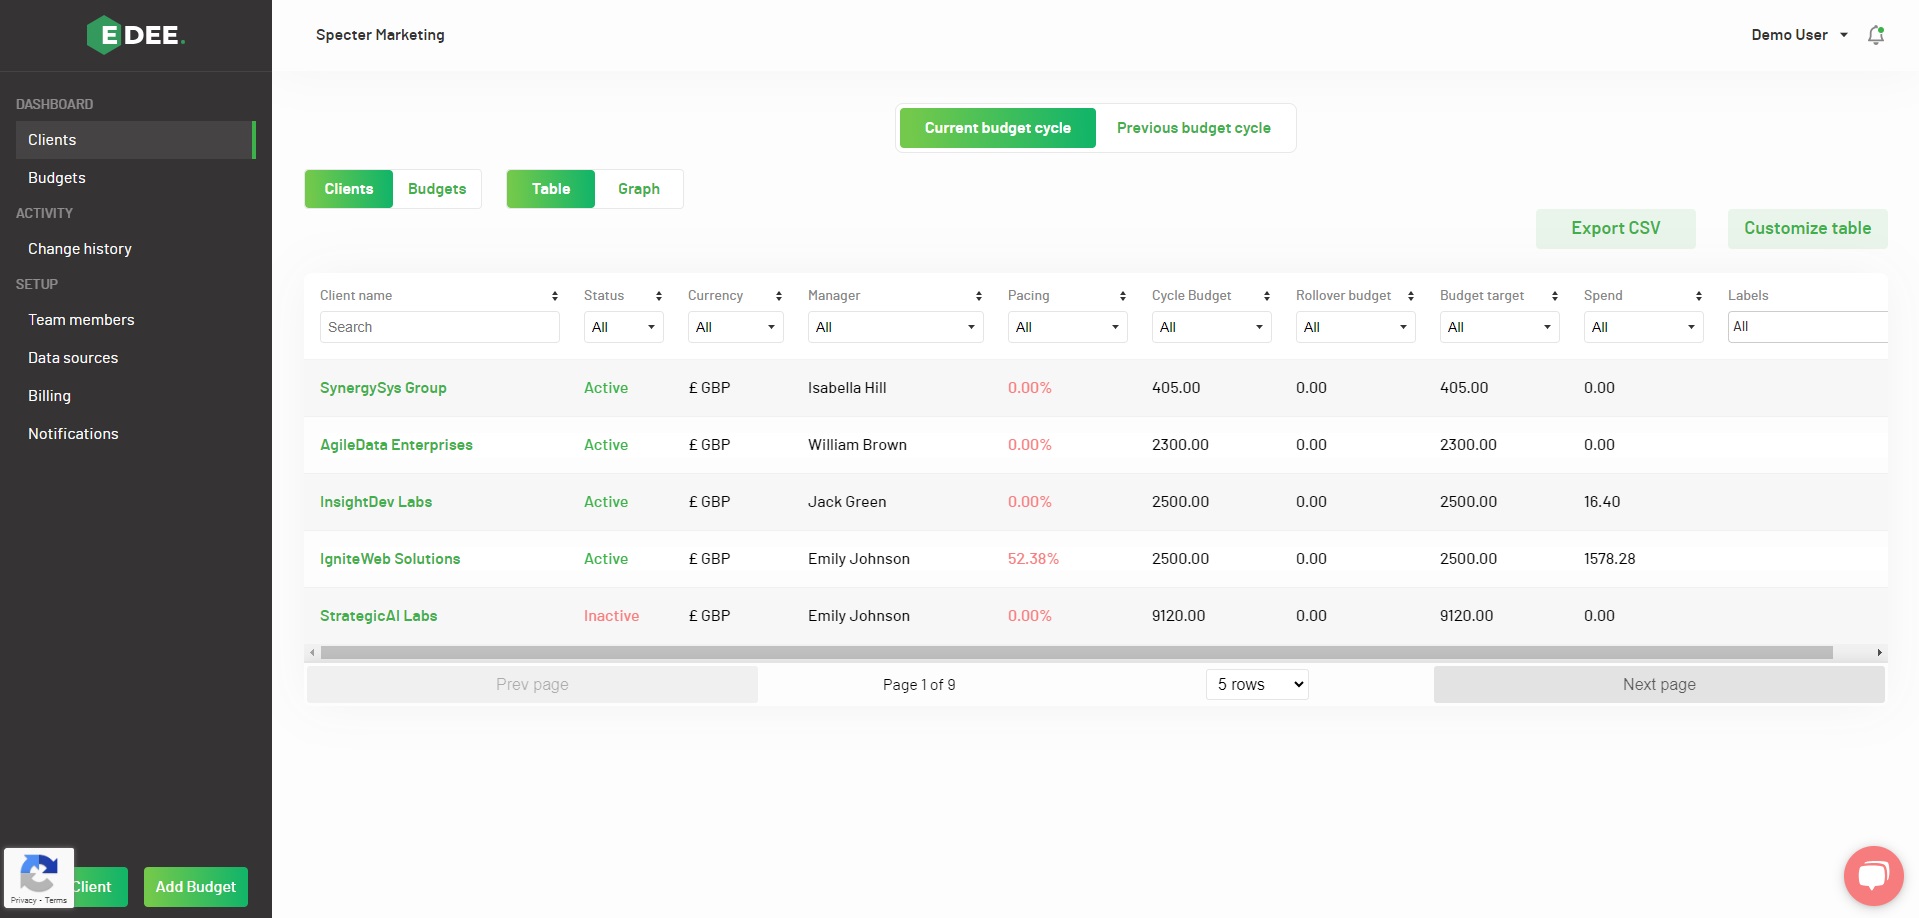
Selecting 'Clients' in the Dashboard section of the menu on the left hand side of the page will present a list of all the Clients to which you have access:
By default, your data will be presented in a table displaying the current Budget cycle.
Alternatively, above the table, 'Previous budget cycle' data can be selected, and the view switched between table or graph
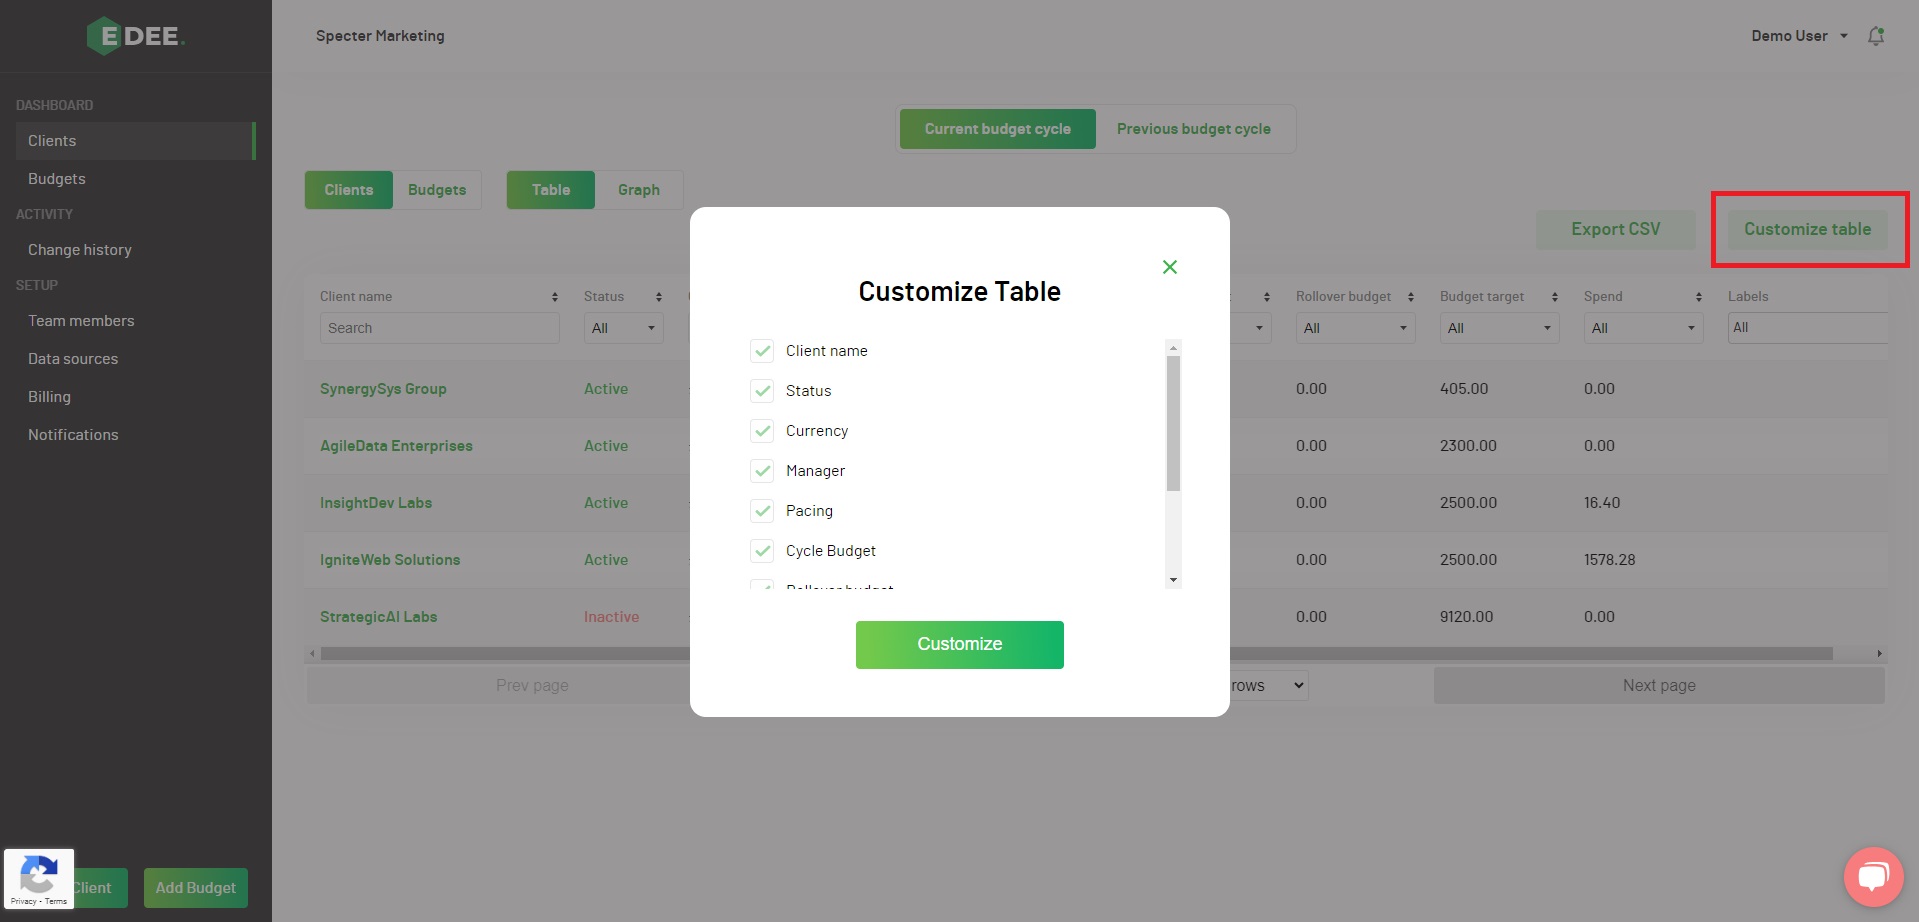
1. A pop-up when clicking 'Customize Table' lists the metrics that can be (un) selected and added / removed:

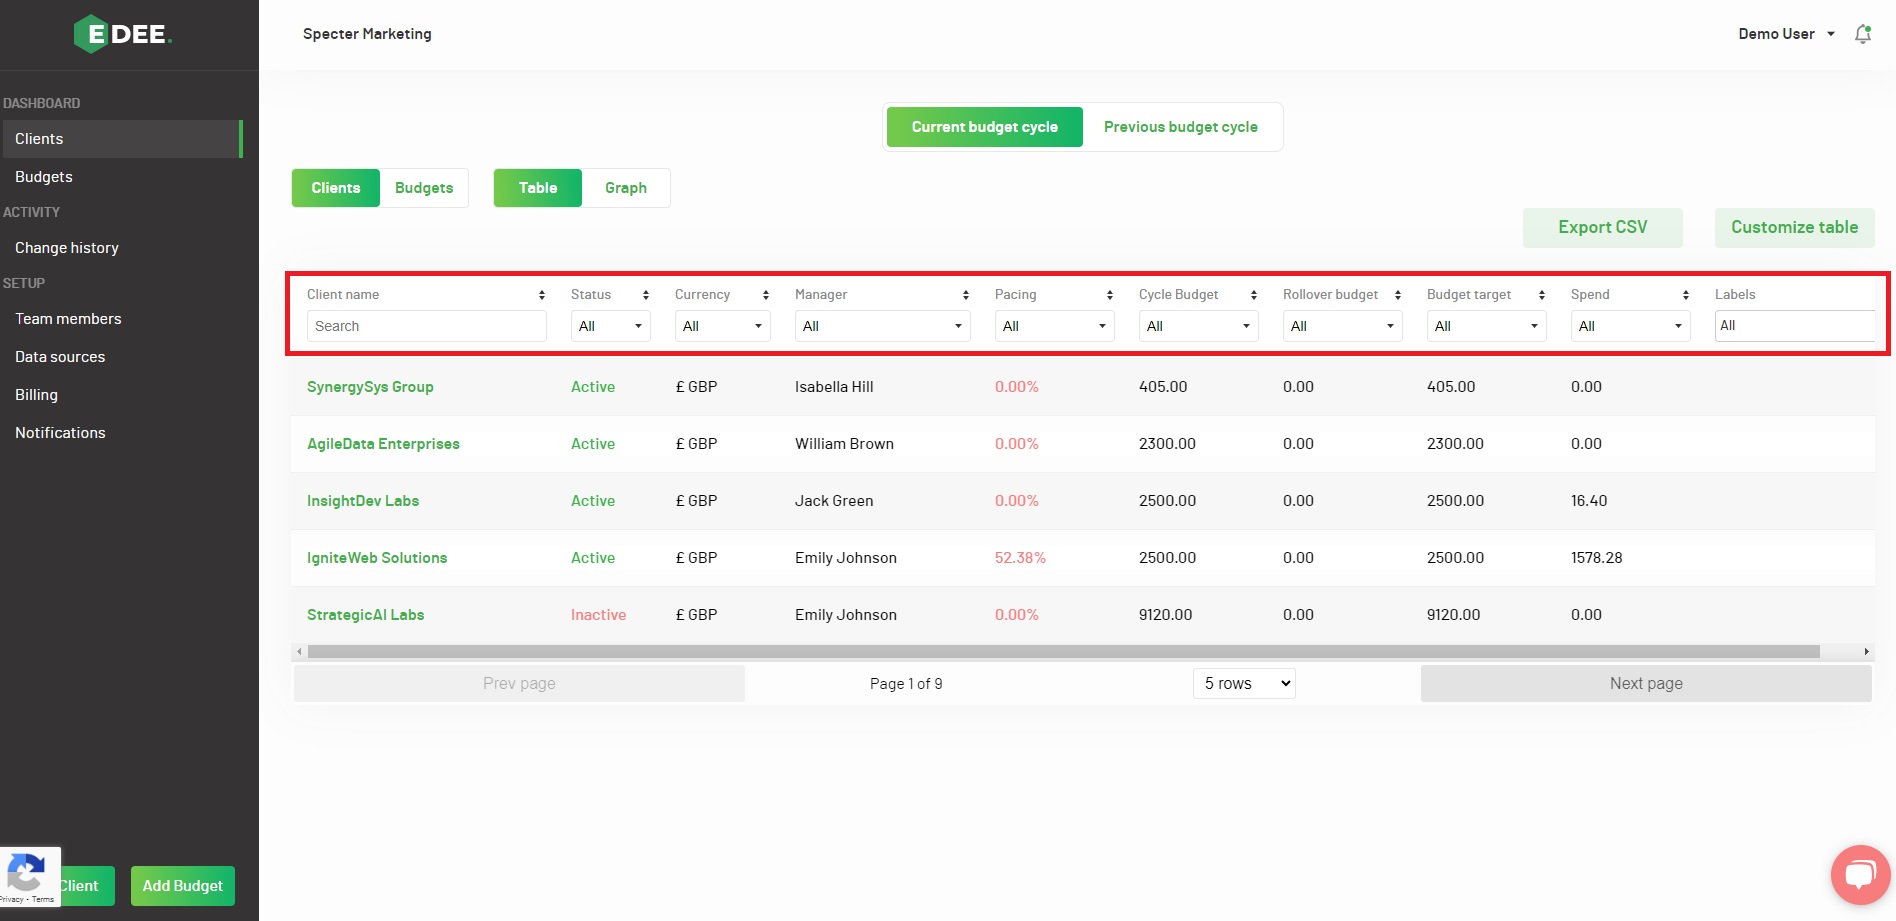
2. Each individual column can be filtered using the arrows to the right of each header and the data sorted in either ascending / descending order:

NOTE - EDEE uses a traffic light system when displaying your budget pacing figures:
Green - if your spend is pacing within 10% (over or under) your target spend for this moment in the budget cycle
Orange - if your spend is pacing between 10 - 20% (over or under) your target spend for this moment in the budget cycle
Red - if your spend is pacing at more than 20% (over or under) your target spend for this moment in the budget cycle
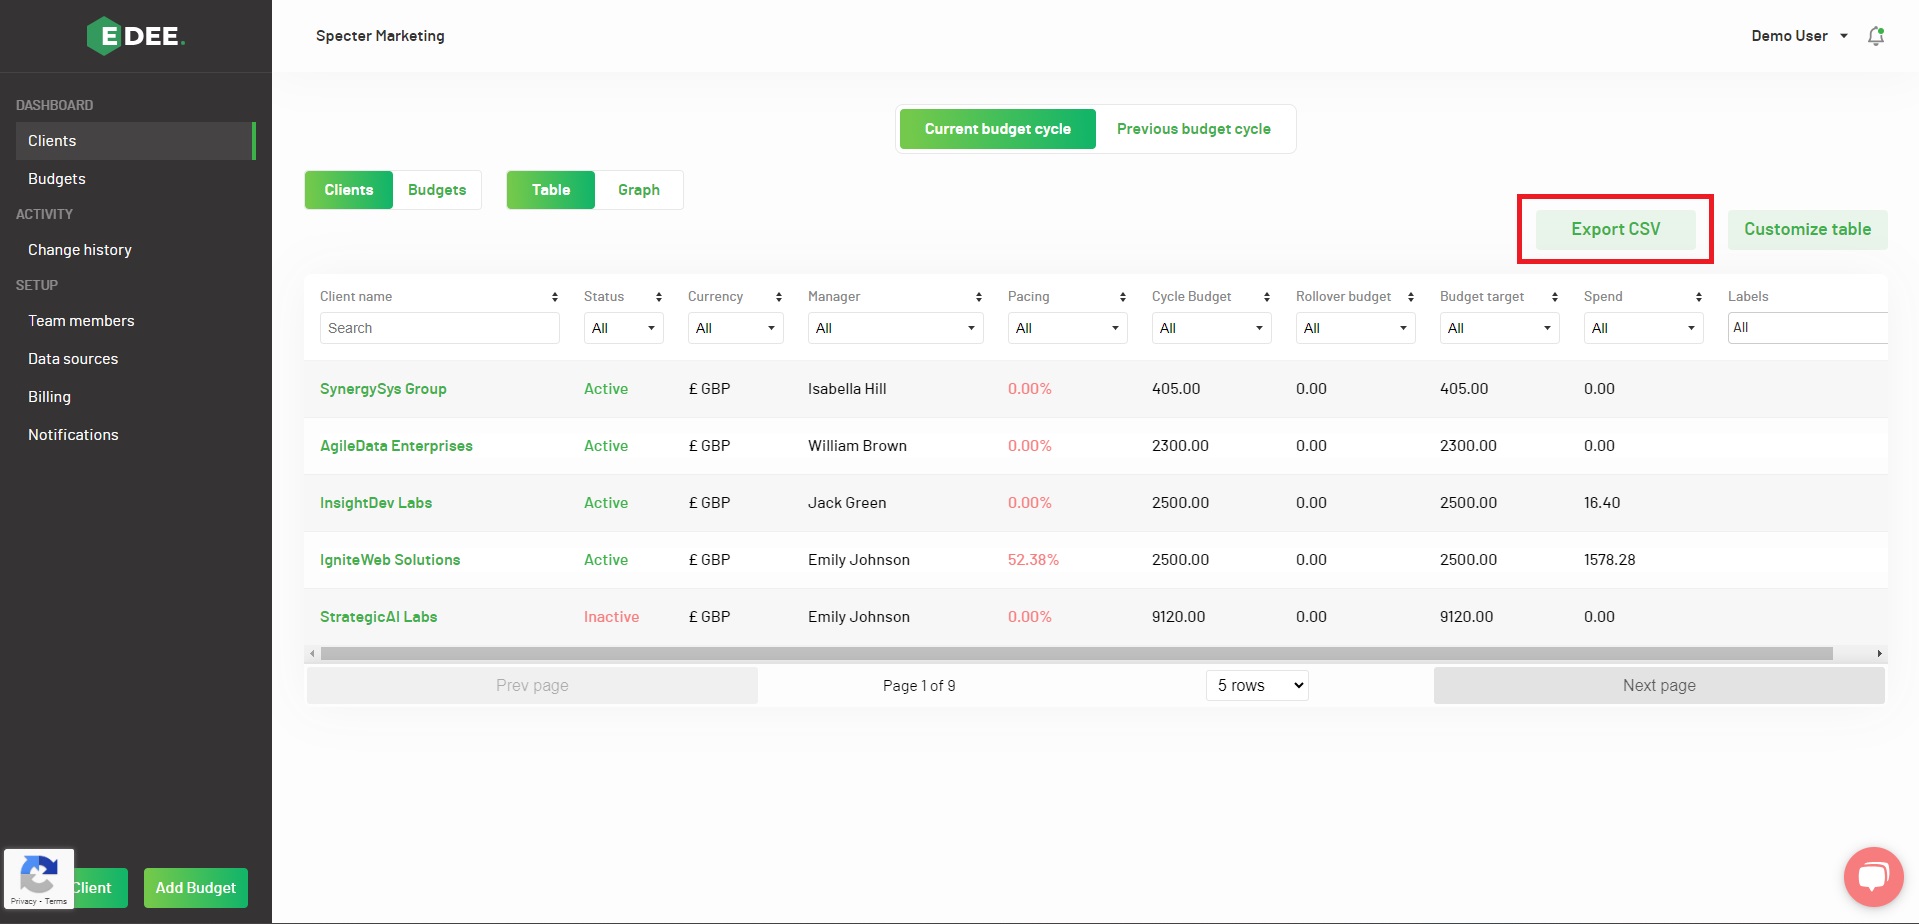
3. Your customized table can be easily exported from EDEE as a file by clicking 'Export CSV'
Note - Look at the data for an individual Client by clicking on their name
Their data will be presented in an individual Client table , with their associated Budgets listed underneath


